Rainfall
Monthly Rainfall Outlook: February 2024
Issued: 30 Jan 2024
For February 2024, below-normal rainfall is predicted over the northeastern Maritime Continent.
For February 2024, below-normal rainfall is predicted over the northeastern Maritime Continent, based on the multi-model ensemble (Figure 4). The ECMWF (Figure 2) and UK Met Office (Figure 3) models show the highest likelihood for below-normal rainfall over the Philippines and northern Borneo, while the NCEP model (Figure 1) has a lower chance of below-normal rainfall, primarily around the Philippines. There is also an increase in chance of above-normal rainfall over the western and central equatorial region (Figure 4), with the UK Met Office model (Figure 3) showing the highest confidence for above-normal rainfall, while the ECMWF (Figure 2) and NCEP (Figure 1) models predict near- to above-normal rainfall for much of this region. The models’ skill is good for the northeastern Maritime Continent and moderate for most of the rest of the region.
For Mainland Southeast Asia, a mix of below- to above-normal rainfall is predicted, based on the multi-model ensemble (Figure 4). All three models (Figures 1-3) predict above-normal rainfall over the northeastern parts of Mainland Southeast Asia, but with low confidence and disagreement on the spatial extent. The NCEP model (Figure 1) predicts below-normal rainfall over Myanmar, although the ECMWF (Figure 2) and UKMO (Figure 3) models predict no dominant tercile. The models’ skill is generally low to moderate for Mainland Southeast Asia.
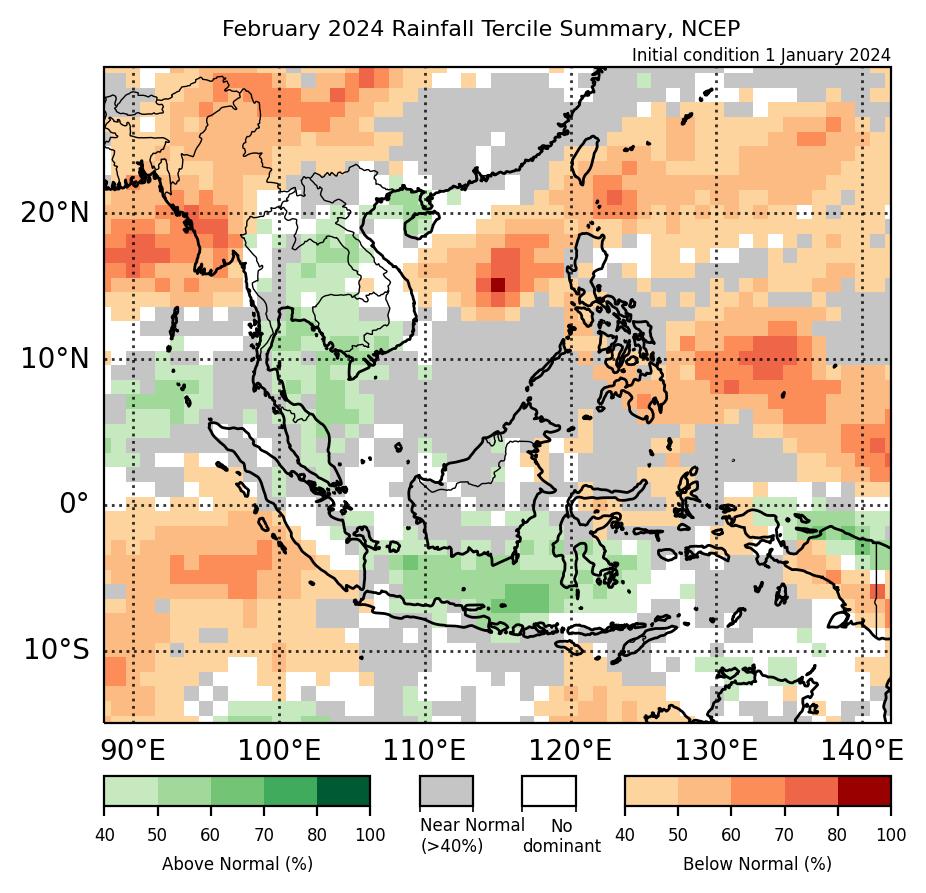
Figure 1: Rainfall tercile summary predictions of NCEP model for February 2024 (contains modified Copernicus C3S information).
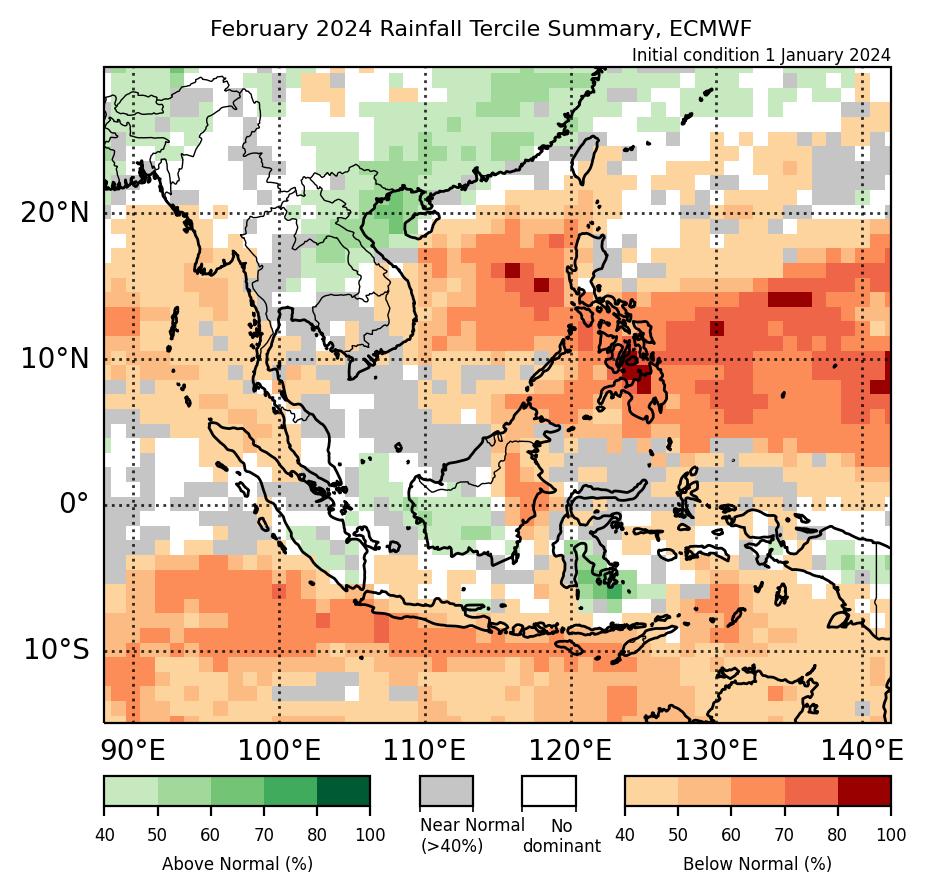
Figure 2: Rainfall tercile summary predictions of ECMWF model for February 2024 (contains modified Copernicus C3S information).
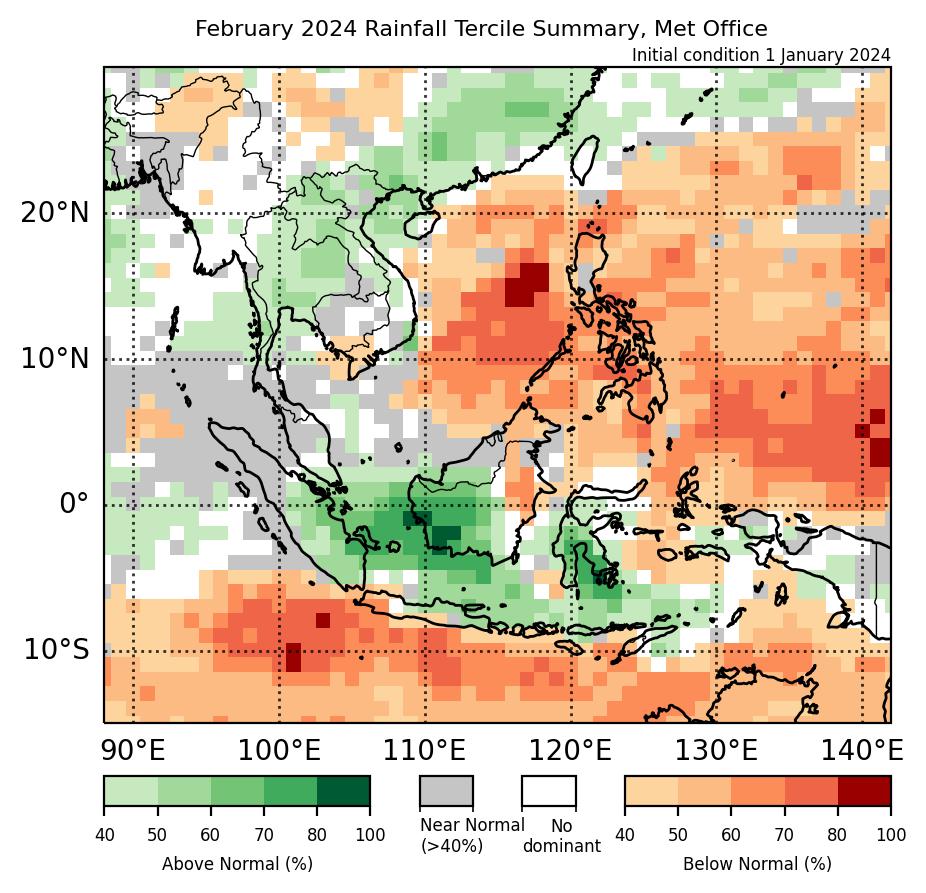
Figure 3: Rainfall tercile summary predictions of UK Met Office model for February 2024 (contains modified Copernicus C3S information).
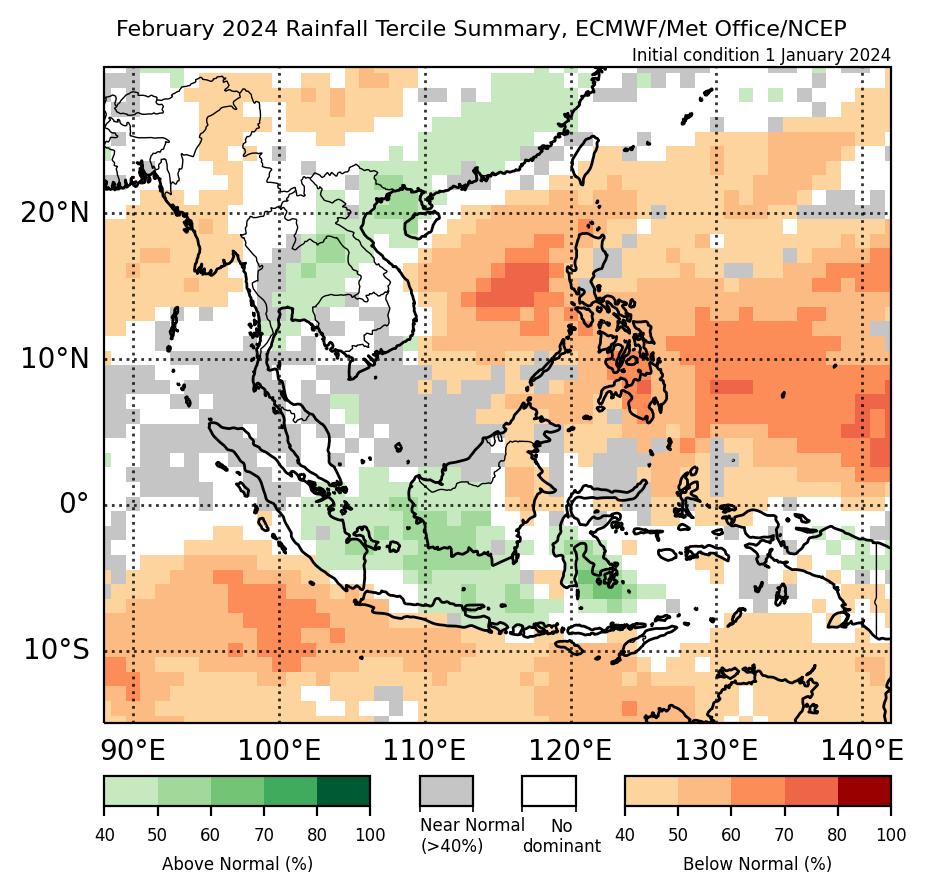
Figure 4: Rainfall tercile summary predictions of the multi-model ensemble for January 2024 (contains modified Copernicus C3S information).

Figure 5: Average climatological rainfall's lower tercile boundary for February based on CHIRPS (Reference period: 1991-2020).

Figure 6: Average climatological rainfall's upper tercile boundary for February based on CHIRPS (Reference period: 1991-2020).
The qualitative outlook is assessed for the region in general. For specific updates on the national scale, the relevant ASEAN National Meteorological and Hydrological Services should be consulted.