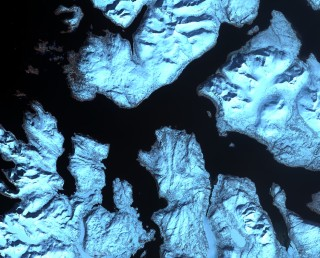
The Climate Visualiser dashboard allows users to browse our collection of maps from the 8-km and 2-km domains and time series for various locations for different Atmospheric variables and of Sea Level. Simply choose from the options available, click submit and visualise.
Melting glaciers and ground water loss (collectively known as changes in land ice and water mass), changes in how water is re-distributed by ocean currents and ocean thermal expansion due to heat absorption all contribute to the total trend in seal-level rise observed by satellite altimeter measurements. Here, contributions to the overall sea-level trend from 1) changes in land ice and water mass, 2) ocean thermal expansion and 3) the total trend are shown separately for the region. Simply 'Select Contribution' and click 'Submit' to view.
Download chart as:

